
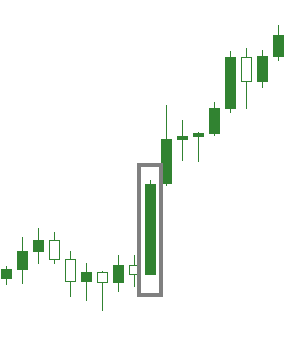
Yo Sen Candlesticks
The Yo Sen candlestick is a single coloured candlestick consisting of a full body and a short non-existent shadow. This candlestick signals a buying opportunity . The longer the body the more bullish the market becomes.
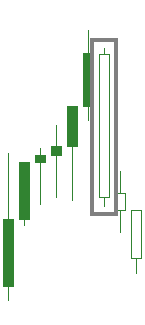
In Sen Candlesticks
Sometimes called Yin is a single white candlestick which signals a selling opportunity. It appears as a downward candle with a full body and very short or not-existent shadows. The longer the body is the more bearish is the candle
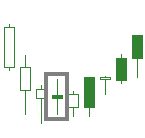
Doji Candlesticks
Doji is formed when the open and the close price are virtually equal. Despite that the upper and lower shadows may vary, the actual Doji candle looks like a cross or a plus sign. It usually means indecision in the market between buyers and sellers and this is due to the fact that the prices move higher and lower during that period but the close price is nearly on the same level as the open price.
Gravestone Doji
It is formed when the opening and the closing price are equal and occur at the low of the specific period. The long upper shadow means that the buying pressure was countered by the sellers. It usually means that the direction of the trend is about to change.
Dragonfly Doji
It is formed when the open and close price are equal with the high of the day. The long lower shadow suggests that buyers and sellers are close to a balance and it usually means that the direction of the trend is nearing a change.
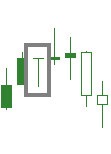
Spinning Top Candlesticks
This specific candlestick can be either bullish or bearish. The most important on this pattern is that the upper and lower shadows are by far larger than the body. This indicates indecision as both buyers and sellers were active during that specific period. They often appear when a trend finishes.
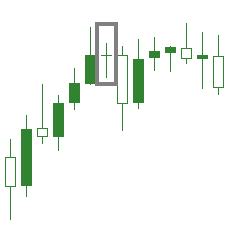
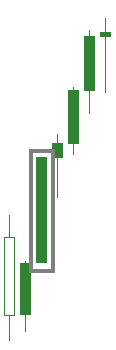
Marubozu Candlestick
This is the candlestick that has no shadow. A bullish Marubozu means that the open price is also the low price and the close price is the high price. A bearish Marubozu has the open price equal to the high price and the close price is also the low price of that period. The Marubozu is considered as a strong continuation pattern as it mainly suggests that the buyers in a bullish Marubozu have total control of the market in a bullish Marubozu and the sellers are in control when it comes a bearish Marubozu.
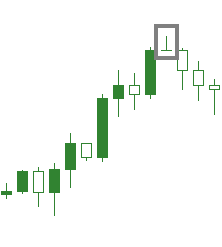
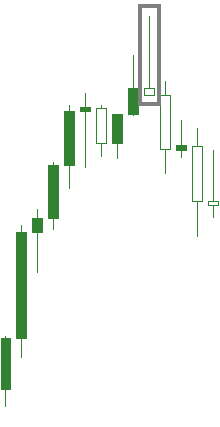
Shooting Star
This is a reversal pattern bearing little or no lower wick with the upper wick as two times the size of the body. It appears in an uptrend and indicates that the uptrend may have reached its top and prices are about to reverse. It opens higher than the previous candle and is traded much higher but it closes near the open price.
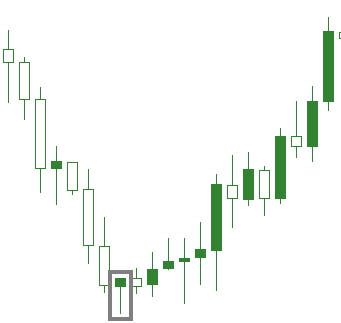
Hammer
This candlestick appears when prices are falling. It indicates that the downtrend may have reached its bottom and prices will advance. The trading occurs significantly lower than the open price but during the period it closes above or close to the open price. It looks like a square with one long lower shadow and signals a buying opportunity.
Hanging Man
This appears when prices rise and indicate that the uptrend may have reached its top and signals that prices are about to move downwards. Hanging man is formed when the price moves significantly lower after the open but then it rallies to close well above the periods low.

Inverted Hammer
This is a bullish reversal pattern. It is an upside down version of the hammer. In a downtrend, the open price is lower and then it trades higher but closes close to its open price. It usually made up of a candle with a small body and a long upper shadow.
The above listed single candlestick patterns are essential to the Japanese candlestick analysis. All Japanese candle patterns are made from the combinations of the basic candlesticks. With the patterns, you can predict when prices are about to change direction or to continue with the existing trend. Traders can pin down the best trading opportunities available in the market and to take advantage of human emotions. When combined with any other analytical tools such as oscillators and moving averages, they can produce more accurate signals.